Text Analysis With Voyant
Goals: Explore at least two corpora of text in Voyant; use the Cirrus, Trends, Summary, and Context visualizations to make some observations about each corpus
Estimated Time to Complete: 1 hour
Use Voyant to Explore Text
Last week, we learned about text analysis, a method of finding patterns across a large collection of texts by looking at characteristics like word frequency (how many times words appear) and word co-occurrence (what words appear near one another).
This week, we’re going to explore our two corpora of texts (20th-century State of the Union Address and Party Platform texts) using Voyant Tools and following the steps below.
Before we begin, however, a note on our data:
As you explore the visualizations in this activity, you might find that you want to read a president’s State of the Union Address or a candidate’s Party Platform in full. The 20th-century text we are working with was taken from UC Santa Barbara’s American Presidency Project site. To quickly access the full text of an Address or Platform statement on the American Presidency Project site, use this table: https://learn-static.github.io/text-analysis/data.html to search for the president/document in question, and click the corresponding link in the table to view the full text.
Step 1. Open a Corpus in Voyant
To walk through the steps in this tutorial, let’s use the State of the Union Addresses. Click on the green button below:
Alternately, you can choose a corpus to view in Voyant from those listed below. When you’ve decided on one, click on the green “View in Voyant Tools” button to the right of it. This will take you to a new browser tab to explore that corpus in Voyant.
| Description | Voyant Link |
|---|---|
| Party Platforms from the 20th century | View in Voyant Tools |
| Democratic Party Platforms from the 20th century | View in Voyant Tools |
| Republican Party Platforms from the 20th century | View in Voyant Tools |
| Party Platforms from 1900-1944 | View in Voyant Tools |
| Democratic Party Platforms from 1900-1944 | View in Voyant Tools |
| Republican Party Platforms from 1900-1944 | View in Voyant Tools |
| Party Platforms from 1948-2000 | View in Voyant Tools |
| Democratic Party Platforms from 1948-2000 | View in Voyant Tools |
| Republican Party Platforms from 1948-2000 | View in Voyant Tools |
| State of the Union Addresses from the 20th century | View in Voyant Tools |
| State of the Union Addresses from 1900-1945 | View in Voyant Tools |
| State of the Union Addresses from 1946-2000 | View in Voyant Tools |
You’ve now opened a set of documents in the Voyant Tools platform. Your webpage will be broken into five different visualizations, looking something like this:
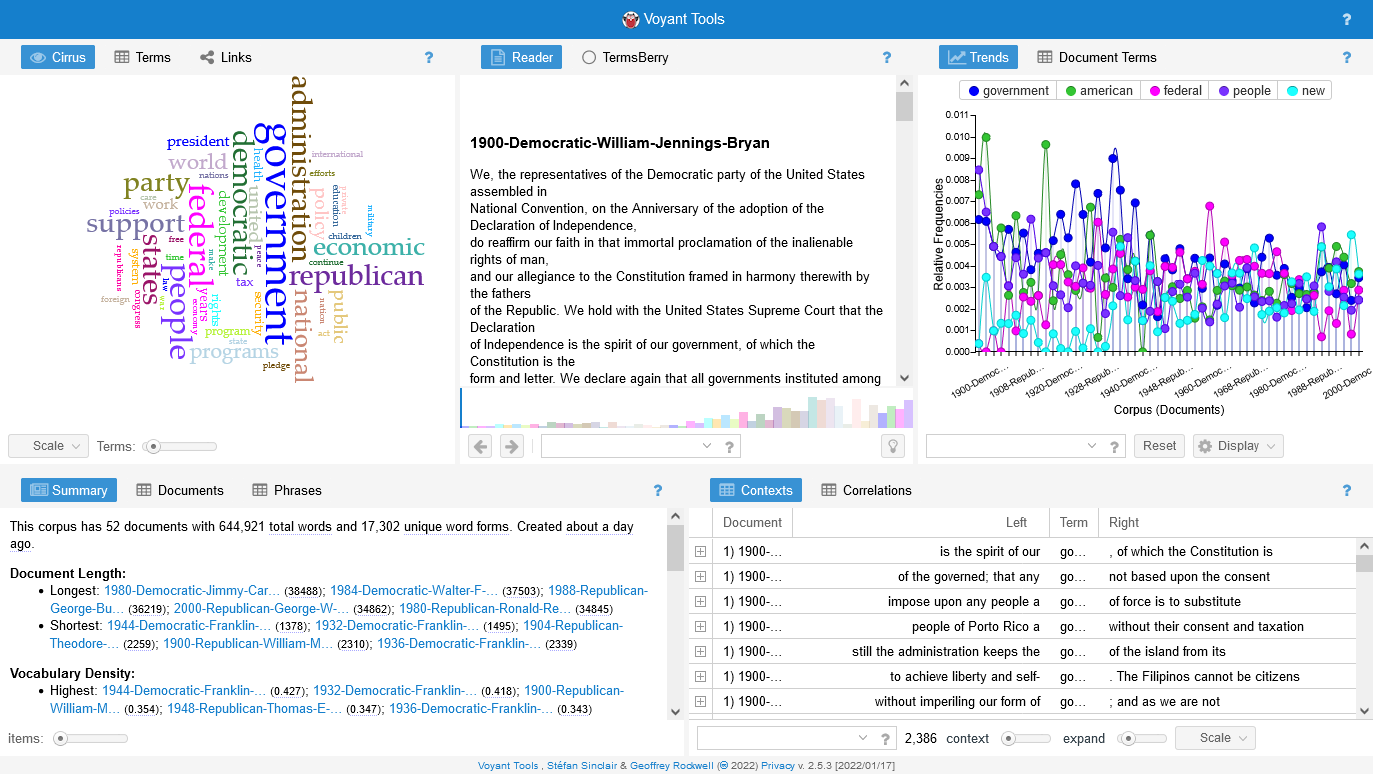
Step 2. What Am I Looking At?
Your instructors have separated each Address in our corpus of State of the Union Addresses into a separate document, then uploaded all of those documents at once into Voyant. For example, Woodrow Wilson’s Address from 1917 is in a file titled 1917-Woodrow-Wilson, the text from Richard Nixon’s 1970 Address is in a file titled 1970-Richard-M-Nixon, etc. Once these files are uploaded to Voyant, Voyant processes and visualizes them in several different ways, so you’ll see these file titles in the Voyant interface. Below, we’ll walk through four different visualizations.
Step 3. Word Clouds
Remember the “bag of words” approach we encountered last week, where a computer takes all the words from a corpus of documents in no particular order and counts the number of times they appear? Voyant uses this method to generate a word cloud, which shows the raw frequency of the top-appearing words in our corpus.
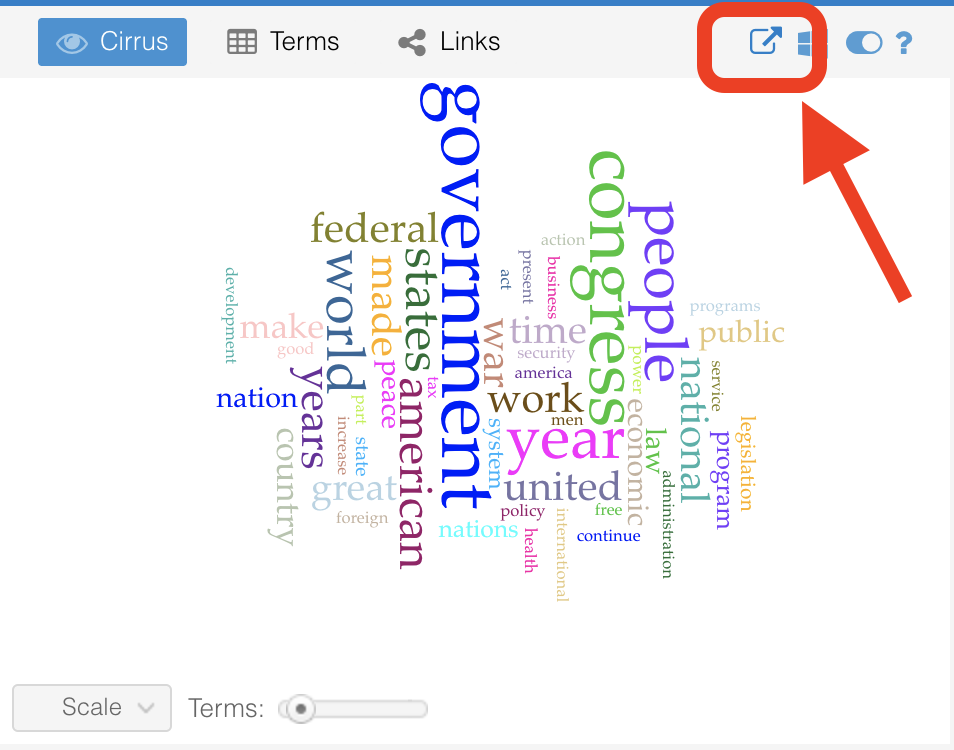
Look to the top left corner of your browser window. See all the colorful words jumbled together? That’s a word cloud. It contains the most frequently-appearing words in the corpus. The larger a word appears in the word cloud, the more frequently it appears across the documents in the corpus.
Let’s expand this visualization to take a closer look:
Hover your mouse just above the word cloud content, to the right of the “Links” button in the toolbar. Look for the icon of a box with an arrow pointing up and out of it. Click on this icon.
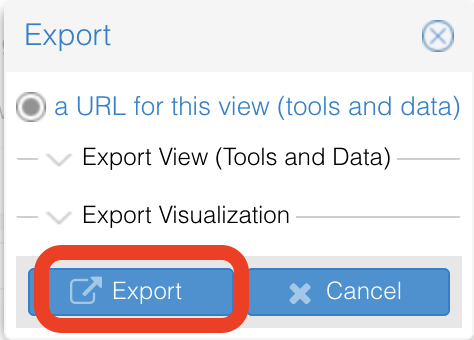
A popup will appear with the Title “Export.” Without clicking on any other options in the popup, click on the blue “Export” button in the bottom left of the popup.
This opens up the word cloud as a full-screen visualization in a new tab in your browser.
Take a look at the words in this word cloud. Do any surprise you?
Let’s adjust some parameters. In the bottom left of the screen, find the slider to the right of the word “Terms.” Slide it to the right. What happens? Is this change helpful? Slide it back to the left to view fewer words.
Right now you are viewing a word cloud that’s been generated from the entire 20th-century State of the Union Address corpus, by default. If you’d like to view a word cloud generated from just one or a few chosen documents in the corpus, you can click on the button in the bottom left of the browser screen that says “Scale.” A list of all the documents in the corpus will appear. Click one or more documents you’d like to see combined into a word cloud.
Do the words change much depending on the documents you select?
To go back to viewing a word cloud created from the entire corpus, click on the “Scale” button again, and select the “Corpus” option. This will regenerate the word cloud from the full corpus.
Switch back over to your original Voyant browser tab (or click the green “State of the Union Addresses” button above) to get back to the Voyant home screen.
Step 4. Word Trends Over Time
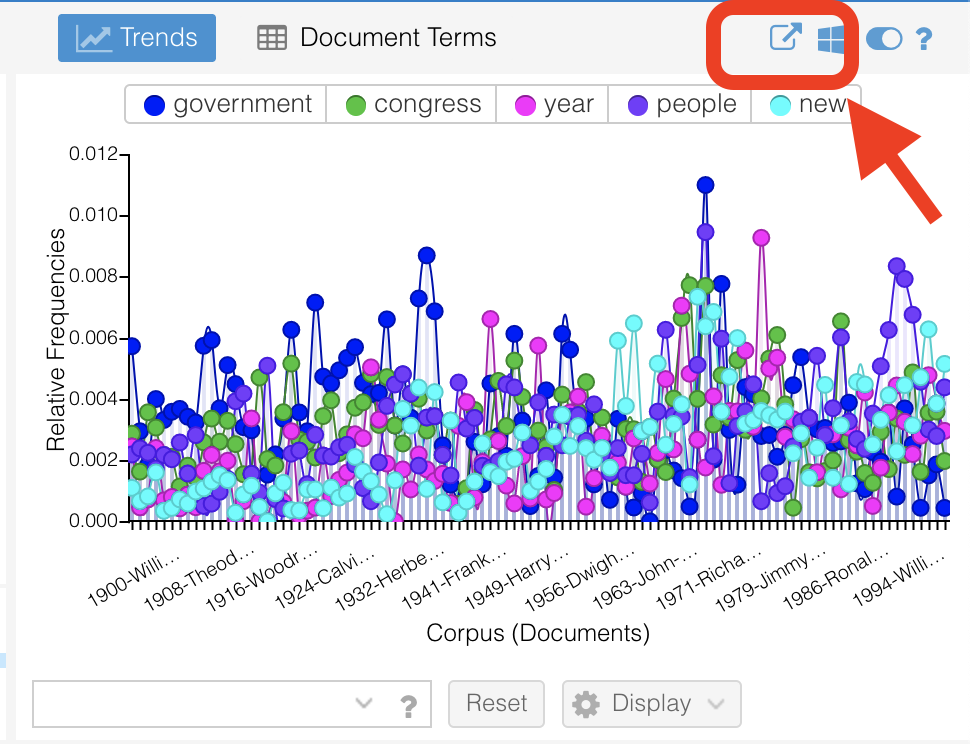
On the Voyant home screen (the home screen should look similar to the image below), find the “Trends” visualization in the top right corner of the browser window.
Hover your mouse in the toolbar just above the visualization, next to the “Document Terms” button, until you see the icon of a box with an arrow pointing up and out of it. Click on this icon.
A popup will appear with the Title “Export.” Without clicking on any other options in the popup, click on the blue “Export” button in the bottom left of the popup.
This opens up the Trends graph as a full-screen visualization.
The Trends graph shows you the relative frequencies of words used over time. Remember relative frequency from last week? Relative frequency is the number of times a word appears in a text, relative to the size of that text. This is in comparison to raw frequency, which is the number of times a word appears in a text. When we looked at our word cloud, we were looking at raw frequency. When we look at this Trends graph, we are looking at relative frequency, or the relative number of times a word appears in each of the texts in our corpus.
Voyant gives us some default terms to visualize at first. You can find these words at the top of the visualization, above the line graph (recognize any of them from the word cloud?). Each word has a circle with a color to the left of it. That color corresponds to a line on the graph. You can click on one of these default terms to make it disappear from the graph, then click on it again to make it reappear.
You probably have other terms you’d like to visualize besides the default terms that Voyant chose for you. Let’s get rid of the default terms and enter some words we’d like to investigate.
Look in the very bottom left corner of your browser window and locate a blank text box with a dropdown to the right of it. Click into the text box. A list will pop up above the text box that contains all the terms currently on the graph. Ignore this list and type in your own term. For instance, type the word “war” into this box. You’ll see a list of options for war appear in the list above the text box. Click on the very top option (war*). The asterisk is a wildcard symbol that tells Voyant to select not only the word “war,” but also any words that start with the letters w-a-r.
Once you’ve chosen war, your graph should change so that the only word at the top is “war”. Let’s add another word. Without deleting “war”, click into the text box in the bottom left corner of the browser window again. This time, type in the word “peace.” Select “peace*”. Now analyze your graph. Do the speakers that use the term war most frequently also use the term peace most frequently? Do these two terms often appear together, or do they peak at different points throughout the century?
To get rid of the terms war and peace, click on the “x” that appears to the right of each of them in the text box. Add your own words to the text box and have fun exploring! Keep your word cloud in mind–do any of the words that appear in the word cloud display surprising patterns in the Trends graph?
Note that if you’d like to visualize the data in a format other than a line graph you can click on the button titled “Display” in the bottom left corner of the browser window, and select from any of the graph options that appear. You can also reset the Trends graph to the default words Voyant chose for you by clicking on the “Reset” button in the bottom left corner of the browser window.
After you’ve explored, switch back over to your original Voyant browser tab (or click the green “State of the Union Addresses” button above) to get back to the Voyant home screen.
Step 5. Summary Information
On the Voyant home screen (the home screen should look similar to the image below), find the “Summary” visualization in the bottom left corner of the browser window.
Hover your mouse in the toolbar just above the visualization, next to the “Phrases” button, until you see the icon of a box with an arrow pointing up and out of it. Click on this icon.
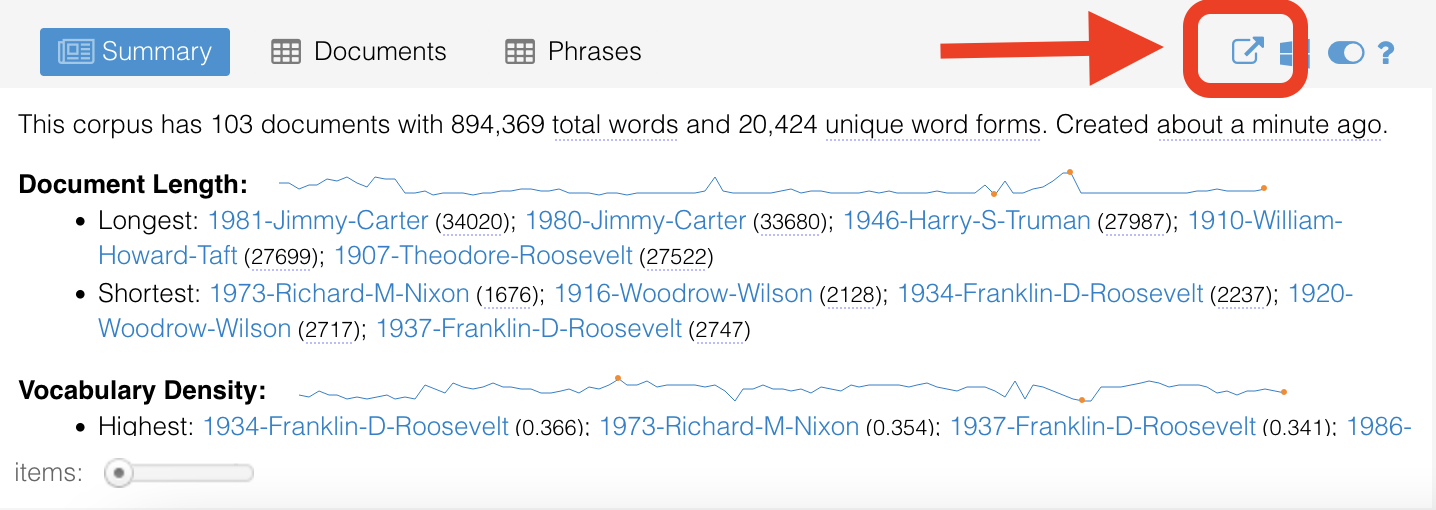
A popup will appear with the Title “Export.” Without clicking on any other options in the popup, click on the blue “Export” button in the bottom left of the popup.
This opens up the Summary information as a full-screen visualization.
The Summary tool provides general information about the corpus. It presents document length, vocabulary density, average number of words, and distinctive words (or words unique to a document) for each document.
Take a look through each of these categories. Do the longest and shortest document lengths surprise you? What about the distinctive words, are they what you would expect each president to talk about?
To increase the number of items in each of the Summary categories, locate the “items” slider and slide it to the right. This may or may not be helpful to you, so feel free to slide it back to the left to reduce the content in the categories again.
After you’ve explored, switch back over to your original Voyant browser tab (or click the green “State of the Union Addresses” button above) to get back to the Voyant home screen.
Step 6. Contexts
On the Voyant home screen (the home screen should look similar to the image below), find the “Contexts” visualization in the bottom right corner of the browser window.
Hover your mouse in the toolbar just above the visualization, next to the “Correlations” button, until you see the icon of a box with an arrow pointing up and out of it. Click on this icon.
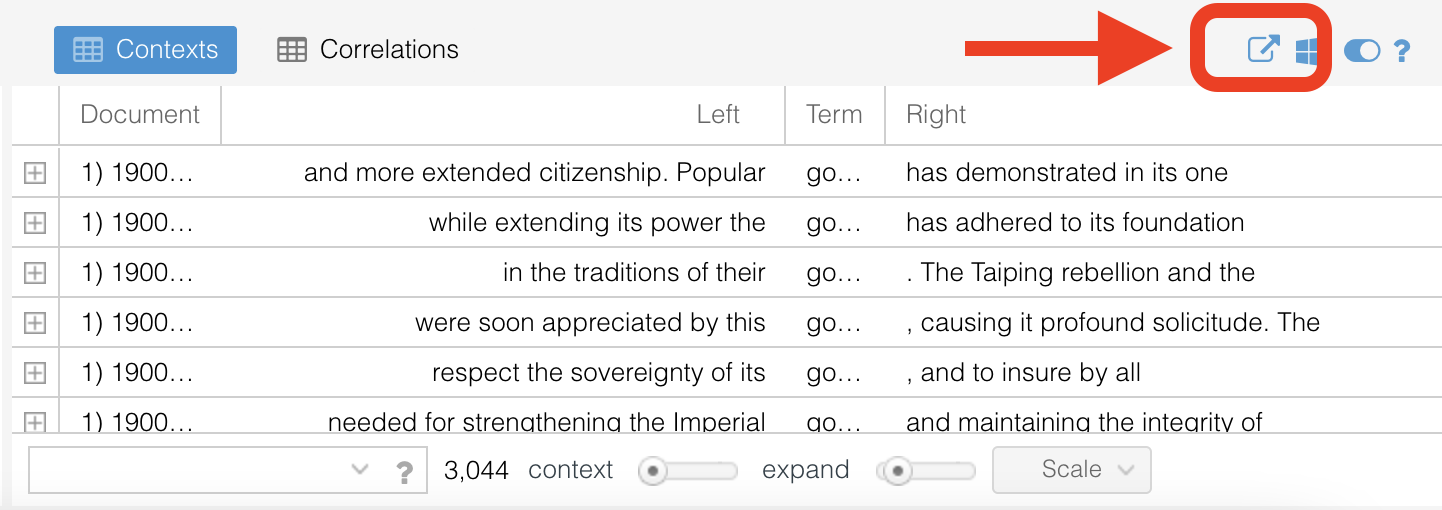
A popup will appear with the Title “Export.” Without clicking on any other options in the popup, click on the blue “Export” button in the bottom left of the popup.
This opens up Contexts as a full-screen visualization.
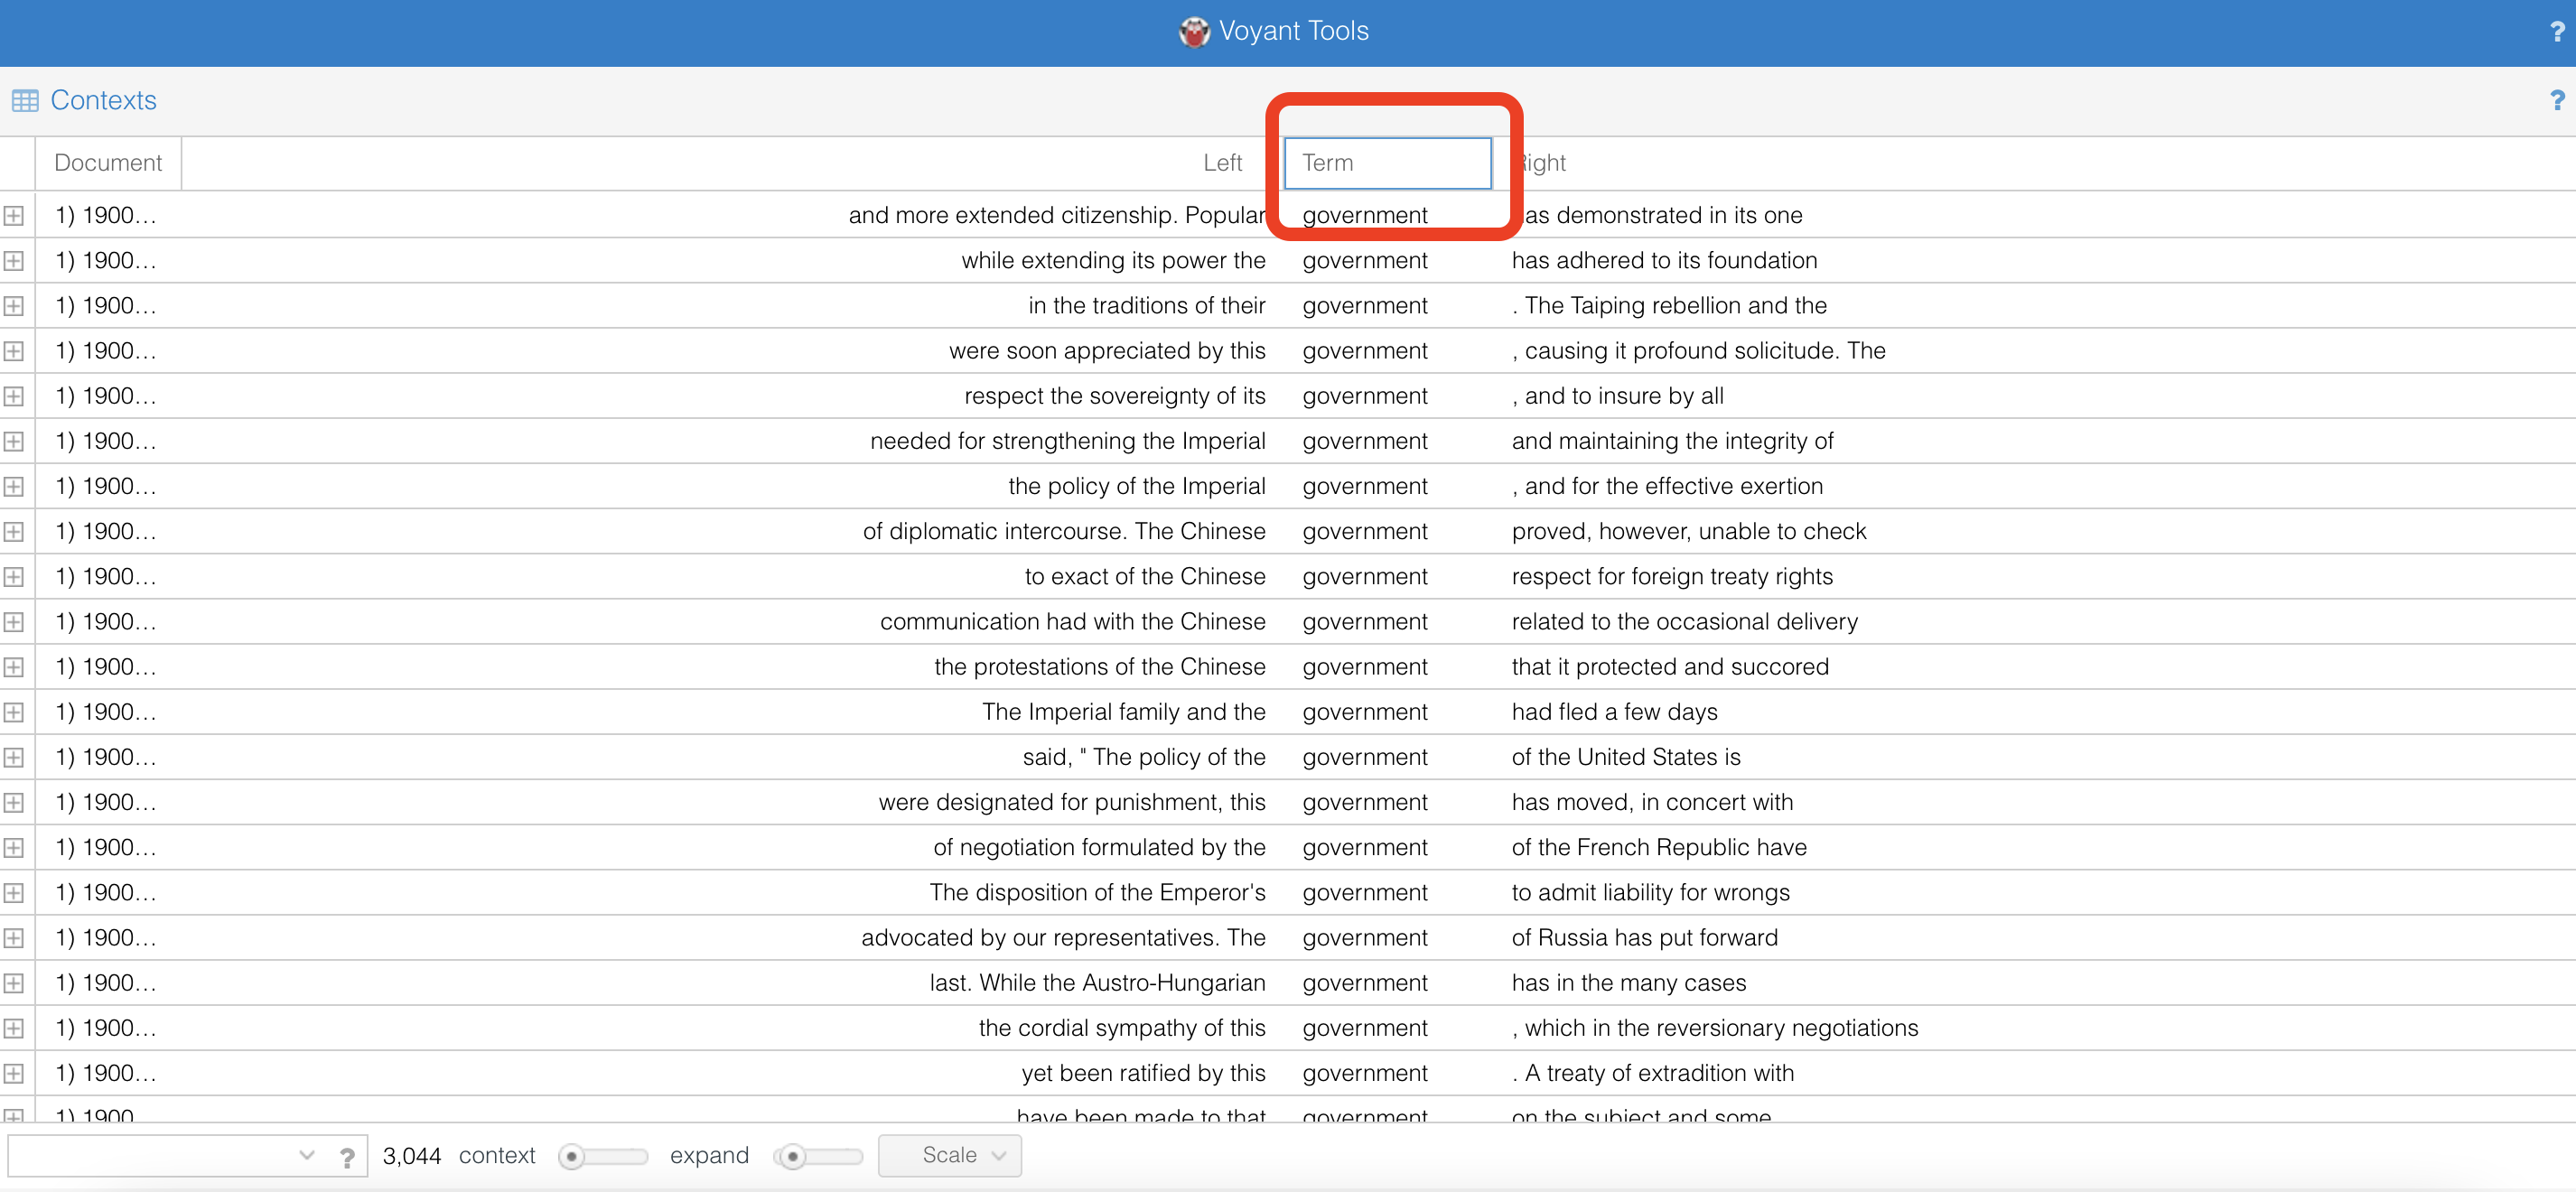
The Contexts tool shows each occurrence of a word along with its surrounding text (the “context”). By default, Voyant shows the context of the most frequent word in a corpus, but you can switch this out for a word of your choosing. The word is situated in the middle column (titled “Term”) of the visualization. Note you may need to expand this column to view the entire word, which sometimes gets cut off if the column is not wide enough.
To add your own word, look in the very bottom left corner of your browser window and locate a blank text box with a dropdown to the right of it. Click into the text box. A list will pop up above the text box that contains all the terms currently on the graph. The words in this list appear most frequently in the corpus. You can choose a word from this list or type in your own word. To continue with our earlier example, type the word “war” into this box. You’ll see a list of options for war appear in the list above the text box. Click on the very top option (war*). The asterisk is a wildcard symbol that tells Voyant to select not only the word “war,” but also any words that start with the letters “war.”
Now “war” should appear in your “Terms” column. You are looking at every instance that “war” appears in a document, along with its surrounding text. In the column titled “Left” are the five words that appear before the word “war,” and in the column titled “Right” are the five words that appear after it. In the left-most column, titled “Document,” you’ll see the name of the document where each occurrence of “war” appears.
To switch out the term “war” with another word, in the text box at the bottom left of your browser window click on the “x” that appears to the right of the word “war.” Add your own words to the text box and have fun exploring!
Right now you are viewing contexts from the entire 20th-century State of the Union Address corpus, by default. If you’d like to view contexts generated from just one or a few chosen documents in the corpus, you can click on the button in the bottom of the browser window that says “Scale.” A list of all the documents in the corpus will appear. Select one or more documents you’d in which you’d like to view your chosen word’s contexts.
To go back to viewing contexts created from the entire corpus, click on the “Scale” button again, and select the “Corpus” option. This will regenerate the contexts from the full corpus data.
Note that you can increase the amount of words that show up before and after your chosen term by moving the slider next to the word “context” at the bottom of the screen. If you’d like to see more than just a few of the words that come before and after your chosen term, you can click the plus icon in the left-most column. This will expand the row so you see more of the context around the word. You can adjust how much text appears when you expand the row by moving the slider next to the word “expand” at the bottom of the browser window.
Switch back over to your original Voyant browser tab (or click one of the buttons in the “Open a Corpus in Voyant” section of this page) to get back to the Voyant home screen.
Step 7. Activity
Now that you know how to read and manipulate Voyant’s default visualizations, use Voyant to seriously analyze and explore the 20th-century State of the Union Addresses and Party Platforms (click on the green buttons below to access Voyant).
In addition to the visualizations we walked through above, you can also choose from one of Voyant’s many other visualizations, documented here: https://voyant-tools.org/docs/#!/guide/tools. Once you’ve explored and gotten used to the Voyant interface, pick one of the corpora (either State of the Union Addresses and Party Platforms), and answer the questions below in your Discussion post for this week’s lab.
- Which corpus did you choose (State of the Union Addresses or Party Platforms)?
- Take note of the words you see in the word cloud. Remember, the larger the word appears in the word cloud, the more frequently it appears throughout the corpus. Does it surprise you that any of the terms in the word cloud are used so frequently in the corpus? Why? Is there a word that you expected to be used frequently but is not in the word cloud?
- What word(s) did you choose to analyze in the Trends visualization?
- Using the Trends graph, did you observe any trends in the use of those words over the course of the 20th century? Keeping in mind the type of corpus you’re analyzing (State of the Union Addresses or Party Platforms) and the time frame you’re analyzing, do you have questions about what caused those trends, or do you have a guess as to what caused them? What are your questions?