Intro to Digital Humanities
Goals: Explore examples of Digital Humanities projects; Gain familiarity with concepts of Digital Humanities/Digital History, text as data, text analysis, and topic modeling
Estimated Time to Complete: 30 minutes
Defining Digital Humanities
As you create your multimedia essay for this course, you will be engaging in the practice of Digital Humanities and Digital History.
At its most general, Digital Humanities can be defined as the process of utilizing technology to ask (and answer) traditional humanities questions in new ways. Digital History is this process applied specifically to History.
This definition is necessarily vague, as digital research in History can range from asking traditional humanities-oriented questions about digital media and computing technologies, to using computational tools and methods to investigate historical data.
Because of these differing definitions, Digital Humanities projects can take a variety of forms.
-
To see just how wide-ranging definitions of Digital Humanities can be, follow this link and refresh the page to view the creative and varying definitions that Digital Humanists have come up with to define what they do: https://whatisdigitalhumanities.com/.
-
Additionally, take a few minutes to explore two or three Digital Humanities projects recently nominated for the 2020 Digital Humanities Awards: http://dhawards.org/dhawards2020/results/.
- Scroll down the page to check out the different categories of projects.
- Which categories appeal the most to you?
Most importantly, when we engage in Digital Humanities and Digital History research projects, it is not to replace traditional humanities research methods. Rather, the digital tools we use can extend the possibilities of deep thinking and criticism that characterize the humanities.
In the case of this class, we’ll be extending our understanding of 20th-century American history by performing computational analyses on–and visualizing patterns in–historical texts (20th-century State of the Union Addresses and Party Platform texts, to be exact), and communicating our findings via the digital medium of a web essay.
A note on the essay: Please know that your entire multimedia essay won’t be about State of the Union Addresses and Party Platforms. These texts will just provide background information, evidence, and sparks for ideas. Your individual projects will use this material to inform your own questions and conclusions.
At this point, it’s understandable that you might be asking, “Why do we need to do this?”
And the answer is we don’t necessarily need to do it–it’s true that you might not discover anything useful from our analyses or visualizations and you might decide that you never want to dabble in Digital History again after this course is over, and that’s fine!
However, we are going to make use of Digital History methods in this course for the following reasons:
-
To introduce you to methods of gaining information from–and determining patterns across–large collections of primary resources when you don’t have time to read them all. Consider: over the course of the 20th century there are a total of 103 State of the Union Addresses and 52 Republican/Democrat Party Platform statements! Of course, you’ll want to read some of them, but taken as a whole the data outputs and visualizations can become another resource for you along with the primary and secondary sources you gather as you form arguments and opinions about the events and people that shaped 20th-century American history.
-
To introduce you to the experience of writing for the web in a professional way. What you do with your multimedia essay after the course ends is up to you–but even if you choose never to make your essay publicly findable or even choose to delete it, during this class you will gain the experience of writing an essay in a space other than a Microsoft Word Document and integrating resources such as supporting images and documents into the text, an activity that can open up possibilities for creativity that aren’t always present in a typical term paper.
-
To introduce some real-world technical concepts and skills in a fun, low-stakes way. In this class we’ll be utilizing the popular web platform GitHub, where developers all over the world collaborate on projects and code, to store our files and create our websites. Rest assured, we will be doing no coding in this course! But you will walk away with some very basic real-world skills (i.e. familiarity with spreadsheets, Markdown, and GitHub) that just might come in handy some day in your future.
In sum, the best advice I can give you is to approach this project with an open mind. We’re not expecting you to become experts in Digital Humanities methods over the course of this semester, but we are asking that you give these tools a try because you just might walk away with a valuable new insight or skill.
Getting Started
In this course, we’ll be dealing directly with the following three Digital Humanities concepts:
Read through the section below to gain an overview of each concept before we start applying related tools in next week’s lesson.
Text as Data
To undertake the text analysis we’ll be doing in this course, we need to think of our texts as data, or as information that can be separated, organized, and analyzed. In the case of this project, we have two “types” of historical political texts: 20th-century State of the Union Addresses and Party Platforms. Each “type” of text is considered a “body,” or “corpus” (plural: “corpora”), which can be split into smaller “documents,” or individual texts within the corpus.
In the case of our research for this course, we’re delineating each individual address as a separate document within the State of the Union corpus, and each Party Platform as a separate document within the Party Platform corpus.
We’ve already separated the corpora into documents along these lines. View each document as an individual text file on GitHub:
Now that we’ve begun thinking about each document as part of a dataset (one of many documents in a corpus), we can also start to understand a document’s words as data (or “units of analysis”).
Here’s a snippet of text from William McKinley’s 1900 State of the Union address:
Fourth Annual Message: To the Senate and House of Representatives: At the outgoing of the old and the incoming of the new century you begin the last session of the Fifty-sixth Congress with evidences on every hand of individual and national prosperity and with proof of the growing strength and increasing power for good of republican institutions. Your countrymen will join with you in felicitation that American liberty is more firmly established than ever before, and that love for it and the determination to preserve it are more universal than at any former period of our history. The Republic was never so strong, because never so strongly entrenched in the hearts of the people as now. The Constitution, with few amendments, exists as it left the hands of its authors. The additions which have been made to it proclaim larger freedom and more extended citizenship. Popular government has demonstrated in its one hundred and twenty-four years of trial here its stability and security, and its efficiency as the best instrument of national development and the best safeguard to human rights. When the Sixth Congress assembled in November, 1800, the population of the United States was 5,308,483.It is now 76,304,799. Then we had sixteen States. Now we have forty-five. Then our territory consisted Of 909,050 square miles. It is now 3,846,595 square miles. Education, religion, and morality have kept pace with our advancement in other directions, and while extending its power the Government has adhered to its foundation principles and abated none of them in dealing with our new peoples and possessions. A nation so preserved and blessed gives reverent thanks to God and invokes His guidance and the continuance of His care and favor.
As humans, when we read these words in this particular order we understand the information they communicate. We can interpret the grammar and the relationship between words. A computer, however, cannot interpret the implicit relationships between the words in this text sample, because it contains no computer-readable structure or encoding.
And it is precisely because this text has no computer-readable structure that this text is classified as unstructured data.
Another way to think about unstructured data is as a bag of words, where the computer keeps track of the number of times the words appear (otherwise known as the “frequency” of the words), but not the grammar or order of the words.
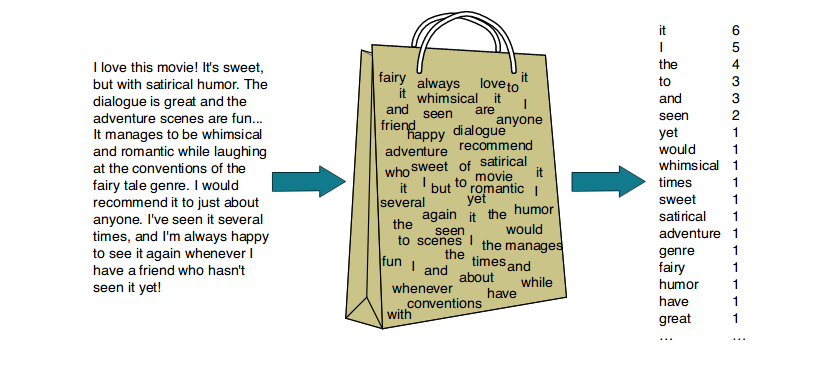
When we use tools that interpret and manipulate documents as unstructured data, some exciting possibilities occur:
- We can analyze word frequency to get an idea of which words appear most often across documents.
- And we can produce and interpret “topics,” or clusters of words, that emerge as themes across a corpus.
To investigate these possibilities, we’ll be using the methods of Text Analysis and Topic Modeling, described below, to analyze our data (that is, our corpora of State of the Union and Party Platform texts).
Text Analysis
The term “Text Analysis” is used to imply the analysis of large bodies of text, looking at characteristics such as word frequency (how many times a word appears) or word co-occurrence (what words appear near one another).
Let’s take word frequency as an example. There are two types of frequency common to text analysis:
- Raw frequency
- The number of times a word appears in a text
- Relative frequency
- The number of times a word appears in a text, relative to the size of that text.
- Example: The word “love” might appear 200 times in a 100,000-word book and 200 times in a 50,000-word book. The word has the same raw frequency in both books, but the 50,000-word book has a higher relative frequency of the word “love” because there are a fewer total number of words in the book.
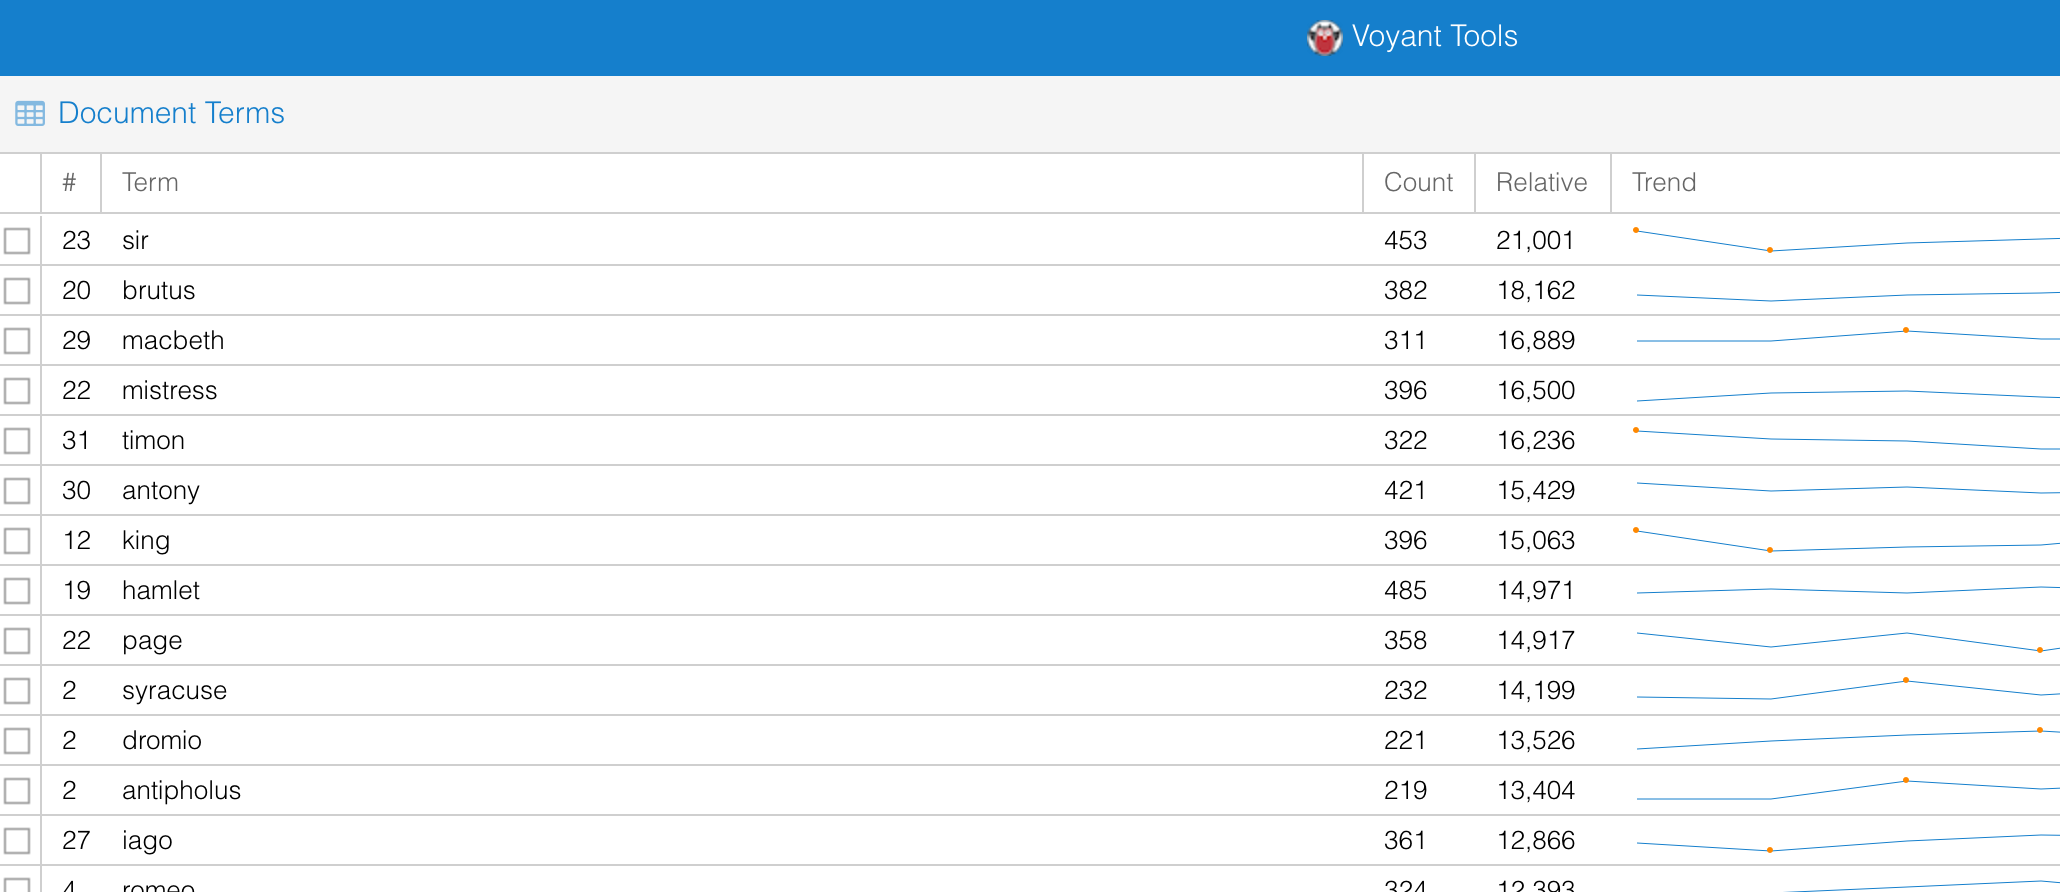
To assign word frequency, we will use a tool that processes our unstructured text data to determine the number of times the words appear. The output of this analysis can be visualized as a simple table displaying words and their frequencies:
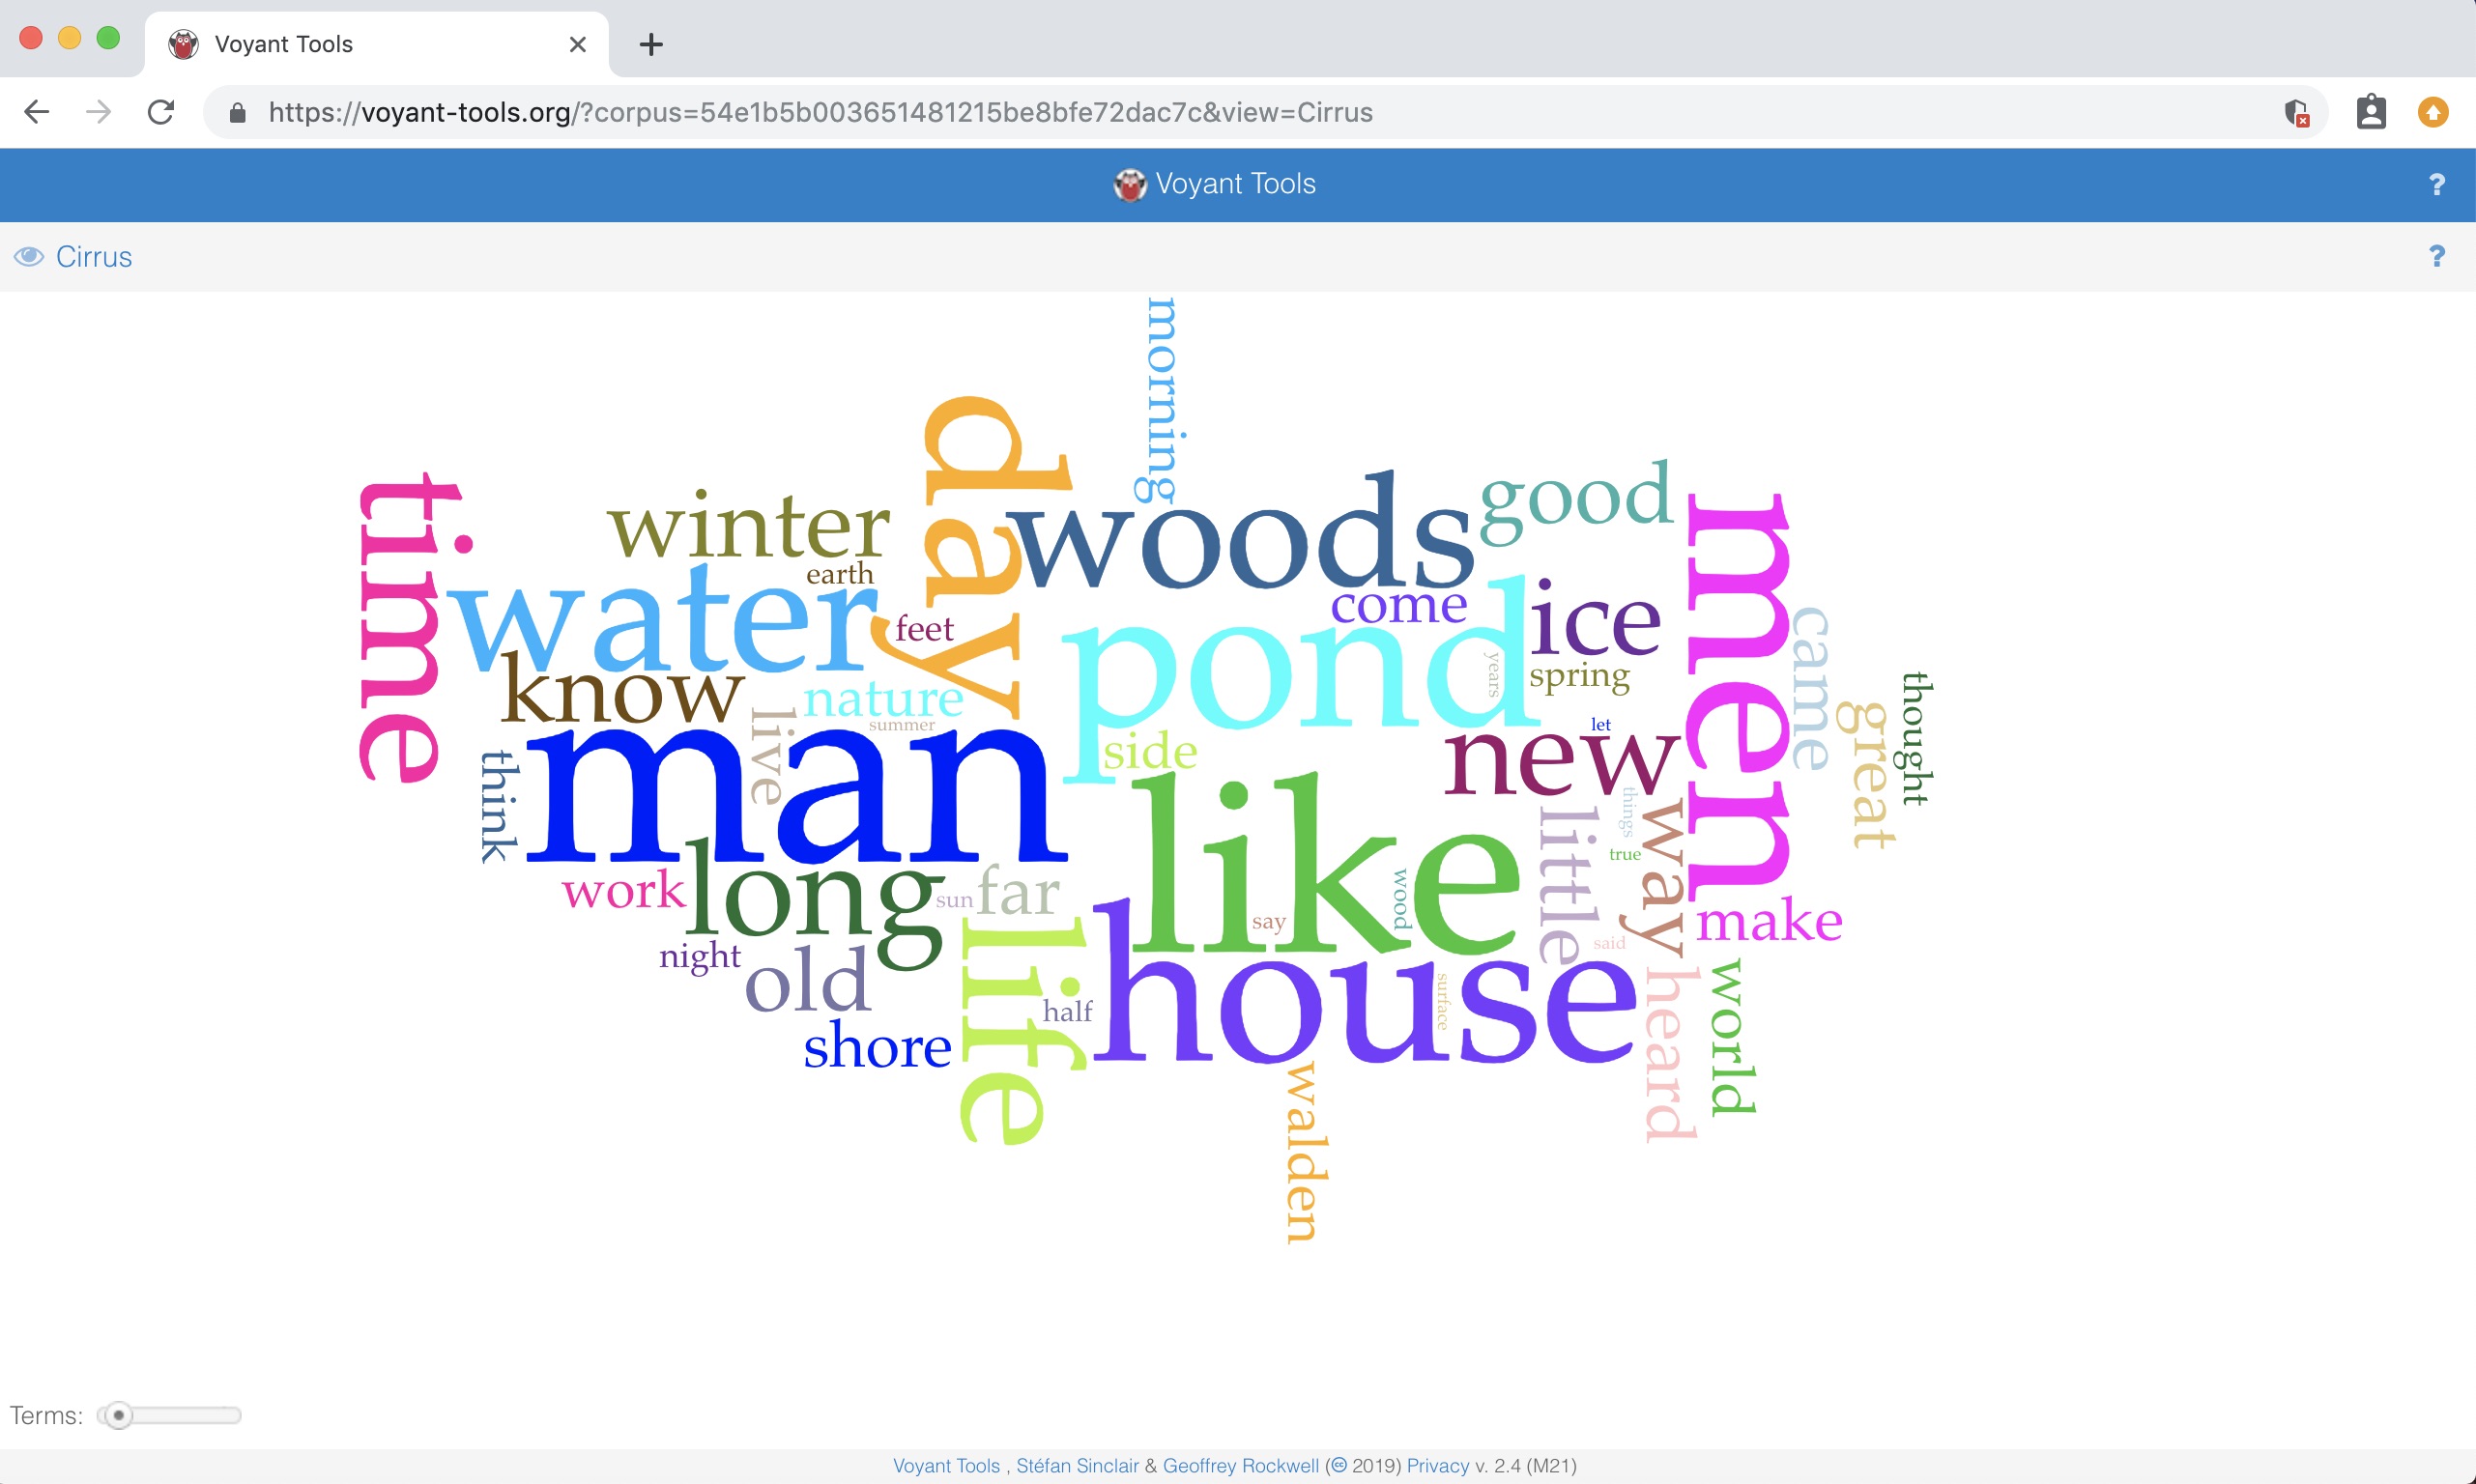
Or as a word cloud:
Text analysis research is often called distant reading by Digital Humanists, because it uses computational methods to “read” (or, more accurately, extract information and visualize patterns across) large corpora.
In theory this process provides scholars with insight into a corpus that would be difficult to reach otherwise, either because they cannot read all the documents in the corpus or because, even if they can read it, they might miss nuanced themes or topics that are only revealed via computational analysis.
Distant reading is most beneficial if you have already read some of your corpus and have a firm understanding of it, and can interpret the results of your text analysis not as the end-goal of your research, but as supporting evidence to be used in tandem with other primary and secondary sources.
Optimally, the text analysis you do will spark new thoughts and questions that you can put into dialogue with your other methods of traditional humanities research.
In this class, we’ll be using Voyant Tools to analyze our corpora of State of the Union and Party Platform texts.
If you’d like to explore Voyant, click on the Voyant Tools link above, then click the “Open” button on the Voyant Tools home page and select “Shakespeare’s Plays” or “Austin’s Novel’s” from the “Choose a corpus” dropdown, then click “Open.” Voyant will automatically create a number of visualizations for you to explore.
Topic Modeling
Topic modeling is a bit more complex than text analysis, so bear with us through this section, and know that you won’t need to be an expert in how topic modeling works to be able to follow the future instructions in this course.
Topic modeling is a type of machine learning. Machine learning refers to the use of algorithms and statistical modeling to allow computers to “learn” from data to do a specific task (note that this concept often overlaps with or is used interchangeably with Artificial Intelligence/AI).
Machine learning tasks are broadly separated into supervised or unsupervised learning. Supervised learning tasks typically involve feeding the algorithm a labeled training data set which is used to build a model that can then classify unknown items, making inferences based on what it knows. Unsupervised learning tasks involve feeding unstructured data (like the text files we define in the Text as Data section above!) to an algorithm that can identify patterns and clustering in the data.
Topic modeling is an example of unsupervised machine learning that allows the user to identify patterns in a corpus of texts, wherein:
- The input is unstructured data (i.e. a corpus of documents)
- The output is several clusters of words that appear in the documents (“topics”), that are identified by an algorithm that finds structure and groupings in your data
Ok, so that’s all pretty abstract, isn’t it? Let’s get more specific to our context:
We’re going to take each text corpus (20th-century State of the Union texts and Party Platform texts, respectively), input them into a topic modeling tool, and that tool is going to analyze and cluster groupings of words based on the probability that they share a similar “theme” or “topic.” The tool is then going to output each of these groupings of text, and we are going to read each grouping and determine if we can interpret and label it as a “topic” that is present across our corpus.
In this scenario, a topic is defined as a group of words that have a high likelihood of clustering together.
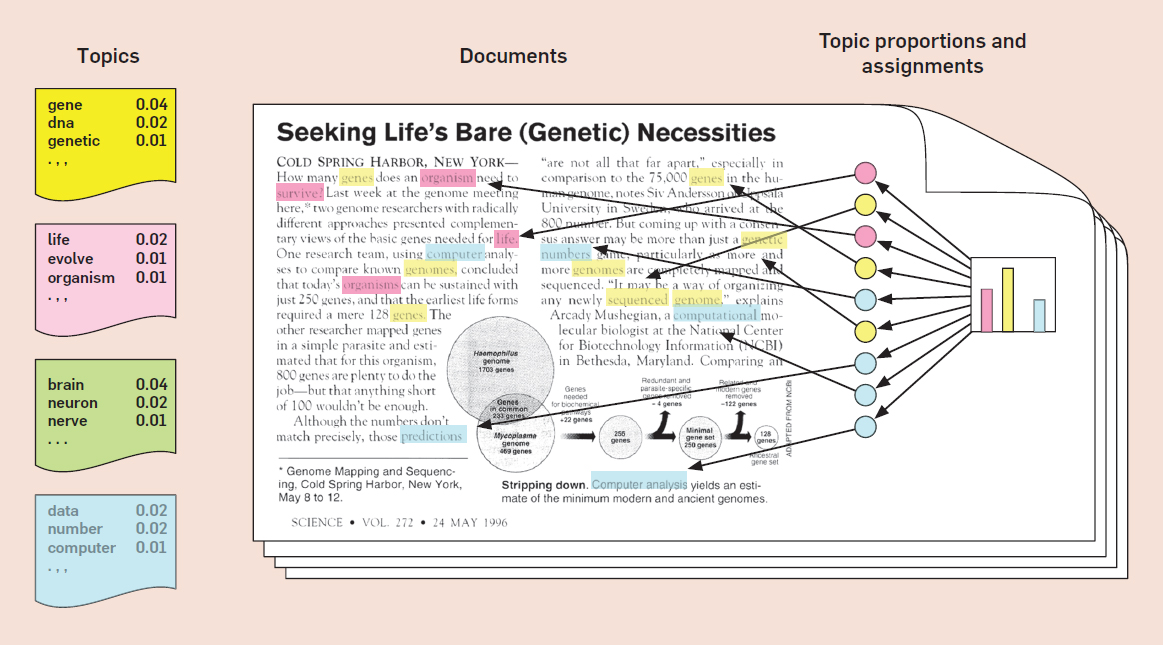
In the visualization of topics being assigned below, the algorithm is sorting words into topics denoted by color (yellow, pink, green, and blue). It will perform this sorting process over and over again until the words are organized into the topics where they are most likely to appear:
If we feed the algorithm our corpus of State of the Union texts, it will apply this sorting process across all the documents and all the words in that corpus, eventually producing topics for us to analyze.
Here’s an example of one topic that was output from the State of the Union corpus:
man laws good business corporations interstate national years navy commerce
The computer won’t assign the topic a label. That task is up to us. As an example, we might read this topic and assign it the label “Commercial America.”
At this point, we’d probably also be interested in visualizing which presidents have the highest presence of this topic in their addresses. All the documents in the corpus share the same set of topics, but each document exhibits those topics in different proportion. Luckily, the topic modeling tool outputs the “weight” (or percentage it appears) of each topic in each document. Let’s take a look:
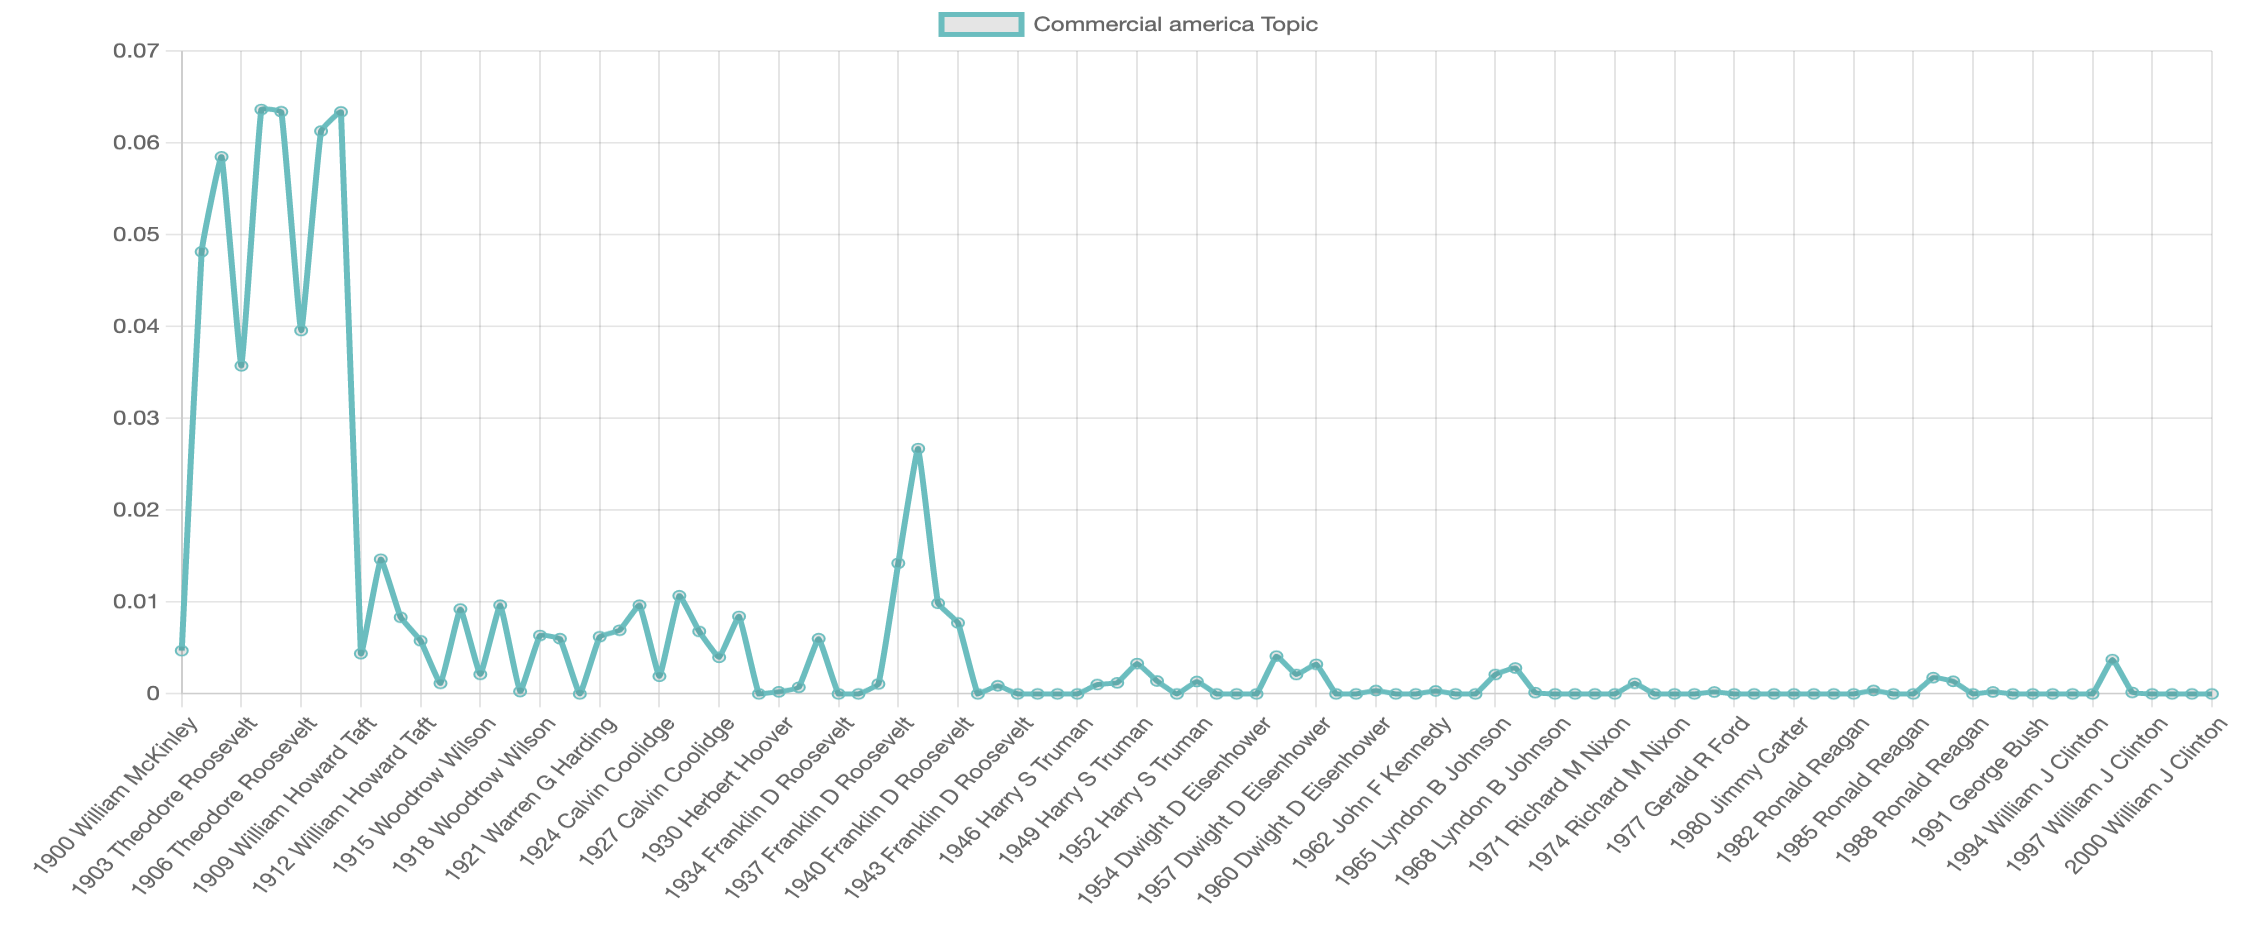
Anything surprising about this? Could you use it as supporting evidence for your essay’s argument? Or do you need to go back and read some of the State of the Union Addresses or other primary or secondary sources to get a better understanding of why everyone was talking about this topic in the first half of the century? Either of these are valid responses. This type of visualization and topic analysis will be a component of your multimedia essays, but not every topic and graph will be useful or directly applicable to your writing.
Sometimes topics are easy to identify (for example the cluster of words “navy, ship, captain” all fit into a coherent theme). Other times they’re more ambiguous (the cluster of words “navy, children, lizards” is less easy to place). Just as with text analysis, the purpose of topic modeling is usually to gain insight into a corpus of text that is too large to read. The results of your topic modeling may confirm your suspicions about the texts, or yield surprising outputs that lead to further research.
The topics that are easy to identify may not surprise you, but the topics that you cannot easily fit into a theme may give you pause and prompt you to ask additional questions about your data.
Topic modeling works best when you’re using it to interpret large bodies of text. A very small corpus is unlikely to yield many useful or specific topics; larger corpora (about the size of the corpora we’re using in this class, or larger) usually generate better results. This is because topic modeling is a machine learning process: the more training data the modeling program has, the more refined its topics become over time.
There are various tools that can be used to employ topic modeling, but for this class we’ll be using an in-browser tool called jsLDA. We will produce topics for each corpus, and you will be asked to interpret, assign labels to, and visualize some of them, the goal being to produce additional support, answers, or questions for your research on 20th-century America.
Note that you won’t actually need to use the jsLDA tool for this course unless you want to. Your instructors have already performed the topic modeling for the State of the Union and Party Platform corpora, so all that remains is for you to interpret and visualize their topic outputs (instructions for doing this will be provided in a later week).
You Made It!
Congratulations! You made it through the technical overview for this course. We know some concepts might not make complete sense yet, but that’s okay! You will become more comfortable with these methods as we start to get some hands-on experience with them in the coming weeks.
Additional Resources
The readings below are not required, but serve as extra resources if you are interested in learning more about Digital History, text analysis, and topic modeling.
Digital Humanities/Digital History
Kathleen Fitzpatrick, The Humanities, Done Digitally, Debates in the Digital Humanities, 2012.
Ted Underwood, Seven Ways Humanists Are Using Computers to Understand Text, The Stone and the Shell, June 4, 2015.
Frederick W. Gibbs, New Forms of History: Critiquing Data and Its Representations, The American Historian, 2016.
Text Analysis
Ted Underwood, Where to Start with Text Mining, The Stone and the Shell, August 14, 2012.
Topic Modeling
Matt Jockers, LDA Buffet, September 29, 2011.
David Blei, Introduction to Probabilistic Topic Models, Communications of the ACM, April 2012.
Cameron Blevins, Topic Modeling Martha Ballard’s Diary, April 1, 2010.
Ted Underwood, Topic Modeling Made Just Simple Enough, The Stone and the Shell, April 7, 2012.